Data storytelling: Hollywood is the wrong model
Filed in Anecdotes, Business storytelling, Communication, Insight
In our data-rich business world, there’s a growing need to present ideas based on insights drawn from data. The field of data storytelling emerged to meet this need partly because the first attempts at data dashboards and visualisations merely presented information rather than explain what was happening, let alone inspire others to make decisions. Stories are ideally suited to explanation and inspiration, but the data storytelling pioneers were using the wrong model for business stories.
When you think of the word ‘story’, what do you think of first? Often, people say ‘movies’, ‘books’, ‘plays’, even ‘video games’. Because these are the types of stories that spring to mind, data storytelling pioneers turned to people such as screenwriters and novelists to learn how to craft a compelling story. In my book Putting Stories to Work, I call this big ’S’ storytelling, but we could just as easily call it the Hollywood approach. The language of the Hollywood approach includes terms like three-act structure, hero’s journey, rising tension, conflict, hooks and resolutions. Sounds exciting, but as you will see, this language is hard to translate into a business story.
I learned about storytelling from a different perspective. Working at IBM as a corporate anthropologist in the 1990s and early 2000s, I collected stories people told in their companies using a focus-group technique we called anecdote circles. I must have heard thousands of naturally occurring business stories. I quickly learned that stories told in business are small, sometimes partially complete anecdotes, casually shared in the way you would answer the question: So what happened? It was low key. I call this small ’s’ storytelling.

So what’s wrong with the Hollywood technique? For starters, an overly crafted story sounds inauthentic to businesspeople, especially in small settings. It’s also hard to shoehorn your data insights into a three-act structure, especially when the storyteller uses a single plot device like the hero’s journey.
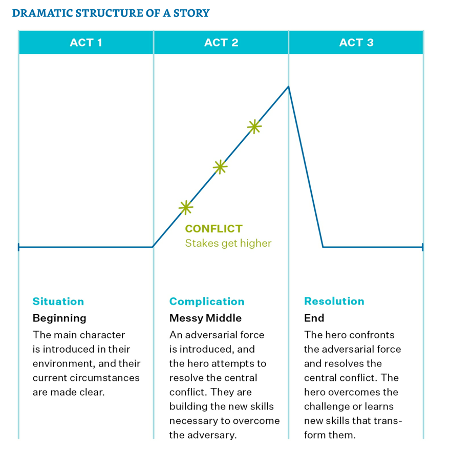
Let’s take a look at how the Hollywood approach gets applied to data storytelling. Nancy Duarte is a presentation specialist in California. (I have one small connection with Duarte: we shared a prize for our books in 2016.) She’s also a strong proponent of the Hollywood method. And she’s not alone in this—most data storytelling authors use it. Here’s her advice for crafting a three-act data story (see the figure below).
You start the story by introducing the main character and explain their situation (Act 1). Then there is a complication that involves a series of events with rising tension, and the hero attempts to resolve this conflict (Act 2). The hero then overcomes their adversary and learns a new skill in the process (Act 3) (Duarte, 2019: 61).
So imagine you’re looking at the sales data for a best-selling product. For 20 years there is a strong correlation between sales and profit. Then, in 2019, that correlation disappears. What happened? Well, when you dig into the data, you discover that you saturated the market. What worked in 2018 in terms of sales and profit is now gone. How do you market your product in this new situation? (This story based on one told in Smith, 2017.)
So where is the hero in this story? Where is the set of events that increase the tension? And what skill did the (non-existent) hero learn? It just doesn’t make sense. For technically minded businesspeople, the Hollywood approach seems unrelated to what they need to get things done.
Story-eliciting questions to find your data story
A simpler approach is to help people find the story by asking story-eliciting questions. I used one, a favourite of mine, in the middle of the story I just told: What happened?
Here are some other questions that will help a story to be told:
- When did things get started?
- What were the turning points?
- Why did that happen?
People wanting to tell a data story only need to know that a story must have a set of connected events, over time, that give us an insight. A good data storyteller then makes recommendations on what to do next.
A simple story structure for a data story
If you want a simple structure for telling your data story, use an uncomplicated clarity pattern, prefaced with a short sentence or two explaining the relevance to the audience (I call this a relevance statement).
Relevance statement …
In the past …
Then something happened …
So now we are doing (or should do) this …
So, in the future, it can be like this …
The data story for our top-selling product would now look something like this:
> A significant change to the sales-to-profit ratio requires a big rethink in how we market our bestseller, product X.
> From 1999 there was a strong correlation between sales and profit for product X. The more we sold, the more profit we generated.
> Then, in 2019, that correlation evaporated. We wanted to know why, so we dug into the data. We discovered that we had finally saturated the market that year.
> So, in this saturated market, we are going to find other niches to fill. We are going to amplify our brand story and look for ways to offer more value so that we can take market share from our competitors.
> In the future, as we find and fill these new niches and expand our market, the relationship between sales and profit will return—although it will never be the same as in the early days when the market was wide open.
Steve Jobs was one business leader who adopted this low-key storytelling approach (watch his introduction of iCloud in 2011), as has Richard Branson (announcing Virgin Australia’s closure in 2020). They did so because it sounds authentic and approachable.
While a story structure can be helpful, it’s not essential. Answering the question ‘What happened?’ is usually enough to get an effective story.
That said, none of this data storytelling works if you don’t start with an insight. That will be the topic of my next post on data storytelling.
Duarte, Nancy. 2019. DataStory: Explain Data and Inspire Action through Story, Kindle edition (Ideapress Publishing: Washington, DC), p. 61.
Smith, Paul. 2017. Sell with a Story: How to Capture Attention, Build Trust and Close the Sale (AMACOM, American Management Association: New York, NY).
About Shawn Callahan
Shawn, author of Putting Stories to Work, is one of the world's leading business storytelling consultants. He helps executive teams find and tell the story of their strategy. When he is not working on strategy communication, Shawn is helping leaders find and tell business stories to engage, to influence and to inspire. Shawn works with Global 1000 companies including Shell, IBM, SAP, Bayer, Microsoft & Danone. Connect with Shawn on: