Blog
Subscribe
Join over 5,000 people who receive the Anecdotally newsletter—and receive our free ebook Character Trumps Credentials.
Categories
- Anecdotes
- Business storytelling
- Collaboration
- Communication
- Corporate Storytelling
- Culture
- Decision-making
- Employee Engagement
- Events
- Fun
- Insight
- Leadership Posts
- News
- Podcast
- Selling
- Strategy
Archives
- March 2024
- December 2023
- November 2023
- October 2023
- September 2023
- August 2023
- July 2023
- June 2023
- May 2023
- April 2023
Years
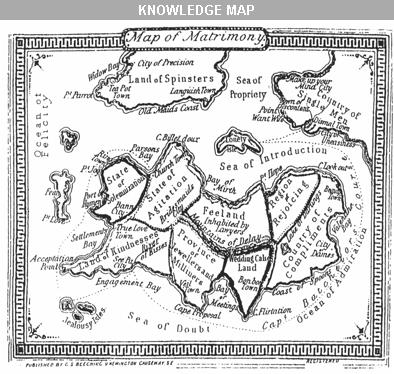
Wow, is this really what a knowledge map looks like?
Here’s a good idea. A neat compilation of a range of visualisation techniques arranged in the form of a periodic table. I was checking out all the different examples by rolling my mouse over each ‘element’ and then notice this one titled ‘knowledge map’.

Hmmm, of all the knowledge maps I’ve helped organisations create, they’ve never looked like this! Mind you, with my love of geography and old cartographic masterpieces, this is a gem. I suspect, however, that Edward Tufte would label it as chart junk—it looks good but it doesn’t tell you anything.
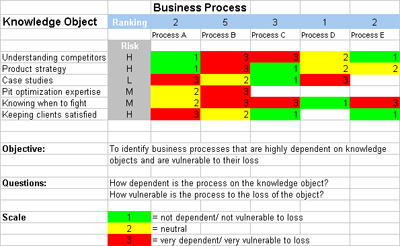
I have talked before about how there’s rarely a single ‘knowledge map’ that adequately describes an organisations knowledge assets (this post also describes the mapping process we use and its origins). The process of identifying and talking about your knowledge assets is more important than the artifact. But if I was to suggest an alternative to the example presented in the Periodic Table of Visualisation Methods I would offer this one.

So to explain my example. The knowledge objects are artifacts, skills, heuristics, experience or natural talents people have in the organisation. The business processes are key processing in the organisation like engagement delivery, client satisfaction, opportunity identification. It’s not unusual to have 30+ processes listed. Ranking is the ranking of the processes from most important to least important (a difficult but important activity for a decision making group). Risk is the likelihood of the knowledge object being lost. This knowledge map is developed by a group of people in a workshop. The aim is to identify important knowledge objects that are vulnerable so initiatives can be designed.
What knowledge mapping techniques do you use?
This approach to knowledge mapping was first developed by Dave Snowden while he worked at IBM. Check out m related post above for all the references.
[via Guy Kawasaki]
About Shawn Callahan
Shawn, author of Putting Stories to Work, is one of the world's leading business storytelling consultants. He helps executive teams find and tell the story of their strategy. When he is not working on strategy communication, Shawn is helping leaders find and tell business stories to engage, to influence and to inspire. Shawn works with Global 1000 companies including Shell, IBM, SAP, Bayer, Microsoft & Danone. Connect with Shawn on: